Solana Validator Economics: The Two Costs Most Operators Underestimate
Solana validator economics is the financial model that determines whether a validator operation makes money. Every Solana validator runs on the same math: six line items, three revenue streams and three cost lines. Block rewards in, costs out, whatever is left is the business.
The six line items that determine the outcome are public, the formulas are stable, and any operator can model them. What trips most operators up is not the math. It is which of the line items are bigger than they look.
The shape of Solana validator economics
A Solana validator is a fixed-cost business with highly variable revenue. Vote costs are nearly identical for every validator on mainnet, regardless of stake size. Server costs fall within a narrow band. Revenue, on the other hand, varies by more than ninety times from the top of the distribution to the bottom.
Two validators running the same hardware, paying the same vote cost, can end the year with wildly different P&L outcomes depending on stake weight, commission, and priority fee capture. Modeling the line items individually gets you part of the way. Understanding which ones actually move the number is what separates sustainable operators from the ones who quietly shut down after twelve months.
The six line items in Solana validator economics
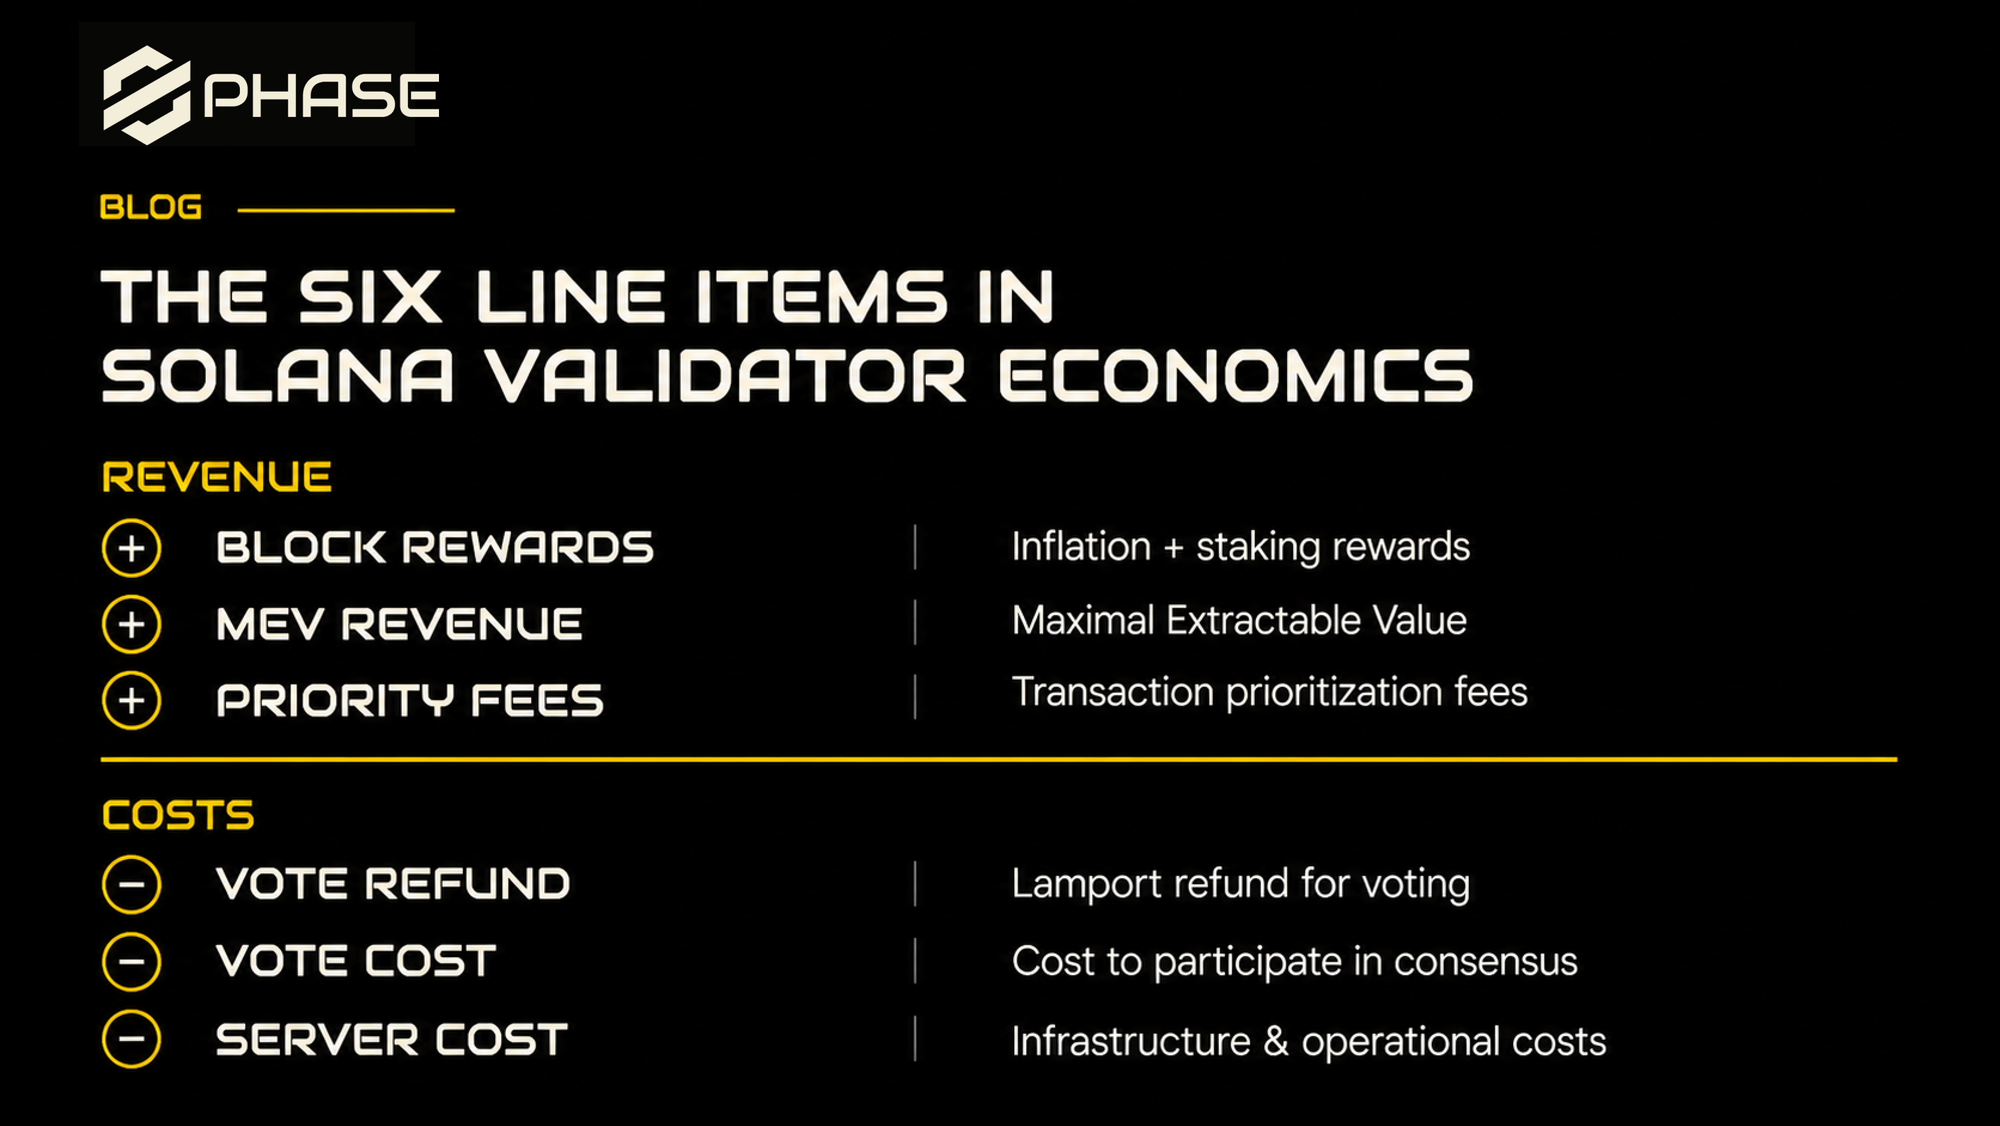
Every validator's economics can be decomposed into three revenue streams and three cost lines.
The first revenue stream is block rewards, the inflation emission Solana mints each epoch and distributes proportionally to staked SOL. The protocol currently pays out roughly 5.7 percent annualized. A validator earns their share based on stake weight, with their commission determining how much flows to the operator versus the delegator. At the median validator (around 189,000 SOL in stake at 0 percent commission), the operator's direct inflation share is effectively zero. At a top-50 validator (median 2.67 million SOL, 4 percent commission), the operator takes home around 3,087 SOL per year from inflation alone. It scales linearly with stake and commission, which means it is the most predictable revenue line.
The second is MEV revenue, earned through Jito's block engine for the 83 percent or more of validators running Jito variants. Direct MEV commission to the validator is essentially zero for the median operator. Only the top decile captures meaningful MEV, and even there the distribution is skewed. The line matters, but not in the way most new operators think.
The third is priority fees, which the Phase Validator Calculator surfaces as "stake revenue." This is the biggest revenue lever, and also the most unevenly distributed. The top 10 percent of validators capture 69 percent of all priority fee revenue on the network. The top 1 percent capture 25 percent. By tier, a top-50 validator earns around 7,561 SOL per year in priority fees. A mid-tier validator in the 150-400 stake rank range earns around 501 SOL per year. A validator in the bottom 90 earns around 82 SOL per year. These are 15 to 90 times differences driven by stake weight, geographic position, and operational quality.
On the cost side, the first line is the vote refund, which is technically revenue but behaves like a negative cost. The Solana Foundation Delegation Program covers vote costs on a sliding schedule for eligible validators: 100 percent for the first three months, 75 percent for the next three, 50 percent for months seven through nine, 25 percent for months ten through twelve, and zero after that. Only the first validator an organization runs qualifies. About one-third of active SFDP validators are currently receiving compensation, with a median annual credit of roughly 89 SOL. The SFDP cliff at month 13 is when many small operators become structurally unprofitable.
The second is vote cost, and it is the most stable number on the entire P&L. Every validator pays 0.000005 SOL per slot, roughly 2.14 SOL per epoch, about 394 SOL per year. The variance across all active validators in the current dataset is under 2 percent. At $83 SOL (at the time of writing), that is roughly $32,700 per year in vote fees, identical for a 10,000 SOL validator and a 10 million SOL validator.
The third is server cost, which sits in a range rather than a fixed number. A bare metal production validator runs $800 to $1,200 per month, or roughly $9,600 to $14,400 per year. Cloud-hosted validators pay $12,000 to $30,000 more for equivalent performance. Firedancer's hardware requirements push the bare minimum higher than Agave ever did: 24-core CPUs at 3.5 GHz or better, 384 to 512 GB of ECC RAM, enterprise NVMe Gen4 or better, 10 Gbps symmetric networking.
That is the full picture. Three revenue streams, three cost lines, all public, all calculable. So where do operators get it wrong?
Which two Solana validator costs operators underestimate
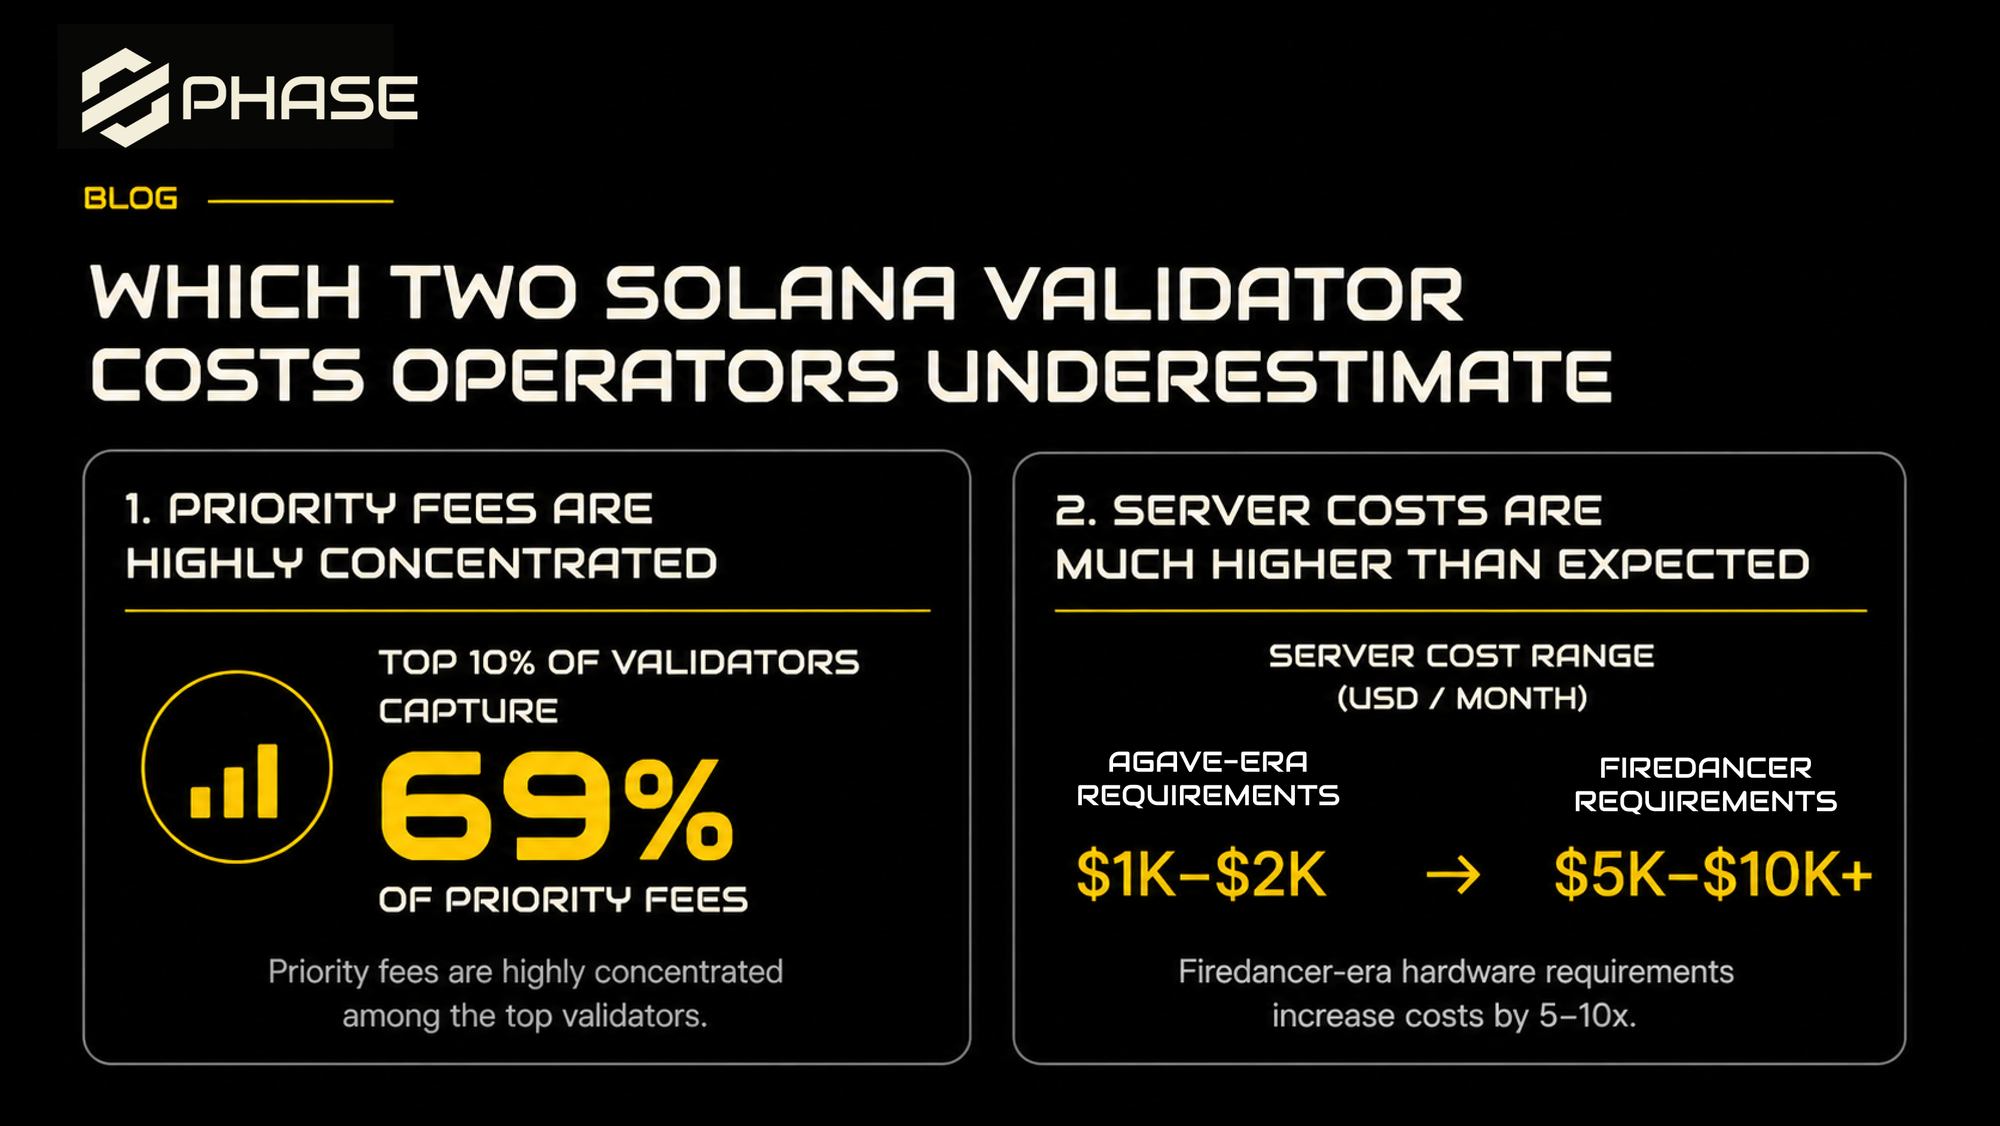
Not vote cost. Vote cost is the most predictable number in the P&L. Any operator who has actually run the math knows it is 312 SOL per year. The real misses are elsewhere.
Server cost is the first. Most operator economic models use hardware assumptions from the Agave era, when the baseline was roughly half of what Firedancer now requires. RAM, networking, and NVMe specs have all ratcheted up. Operators who deployed on older hardware face skip rate degradation, which costs them priority fee revenue, which compounds the miss. Cloud operators often underestimate by a larger factor because the cloud premium over bare metal can add $12,000 to $30,000 per year without an obvious line item on an initial budget.
Priority fee revenue concentration is the second, and it is the one that actually breaks business plans. Operators tend to model expected priority fee income off network averages, assuming their share will scale proportionally with stake weight. The distribution does not work that way. Top 10 percent of validators capturing 69 percent of priority fees means the median validator earns a small fraction of the "average." A new operator estimating "I will capture network-average priority fees proportional to my stake" is wrong by a large factor until they grow past the top decile threshold, which requires existing scale. The math is self-reinforcing: scale earns priority fees, priority fees fund growth, growth earns more priority fees.
There is a third miss worth naming, though it is financial rather than operational. Vote cost and server cost are paid in SOL. When SOL rallies, operating expenses rise in USD terms, which is the opposite of how most businesses work. An operator who budgets in USD and stakes in SOL has unhedged exposure to their own network's price action. It does not hurt during a drawdown. It hurts during a rally.
How Solana validator profitability changes with stake size
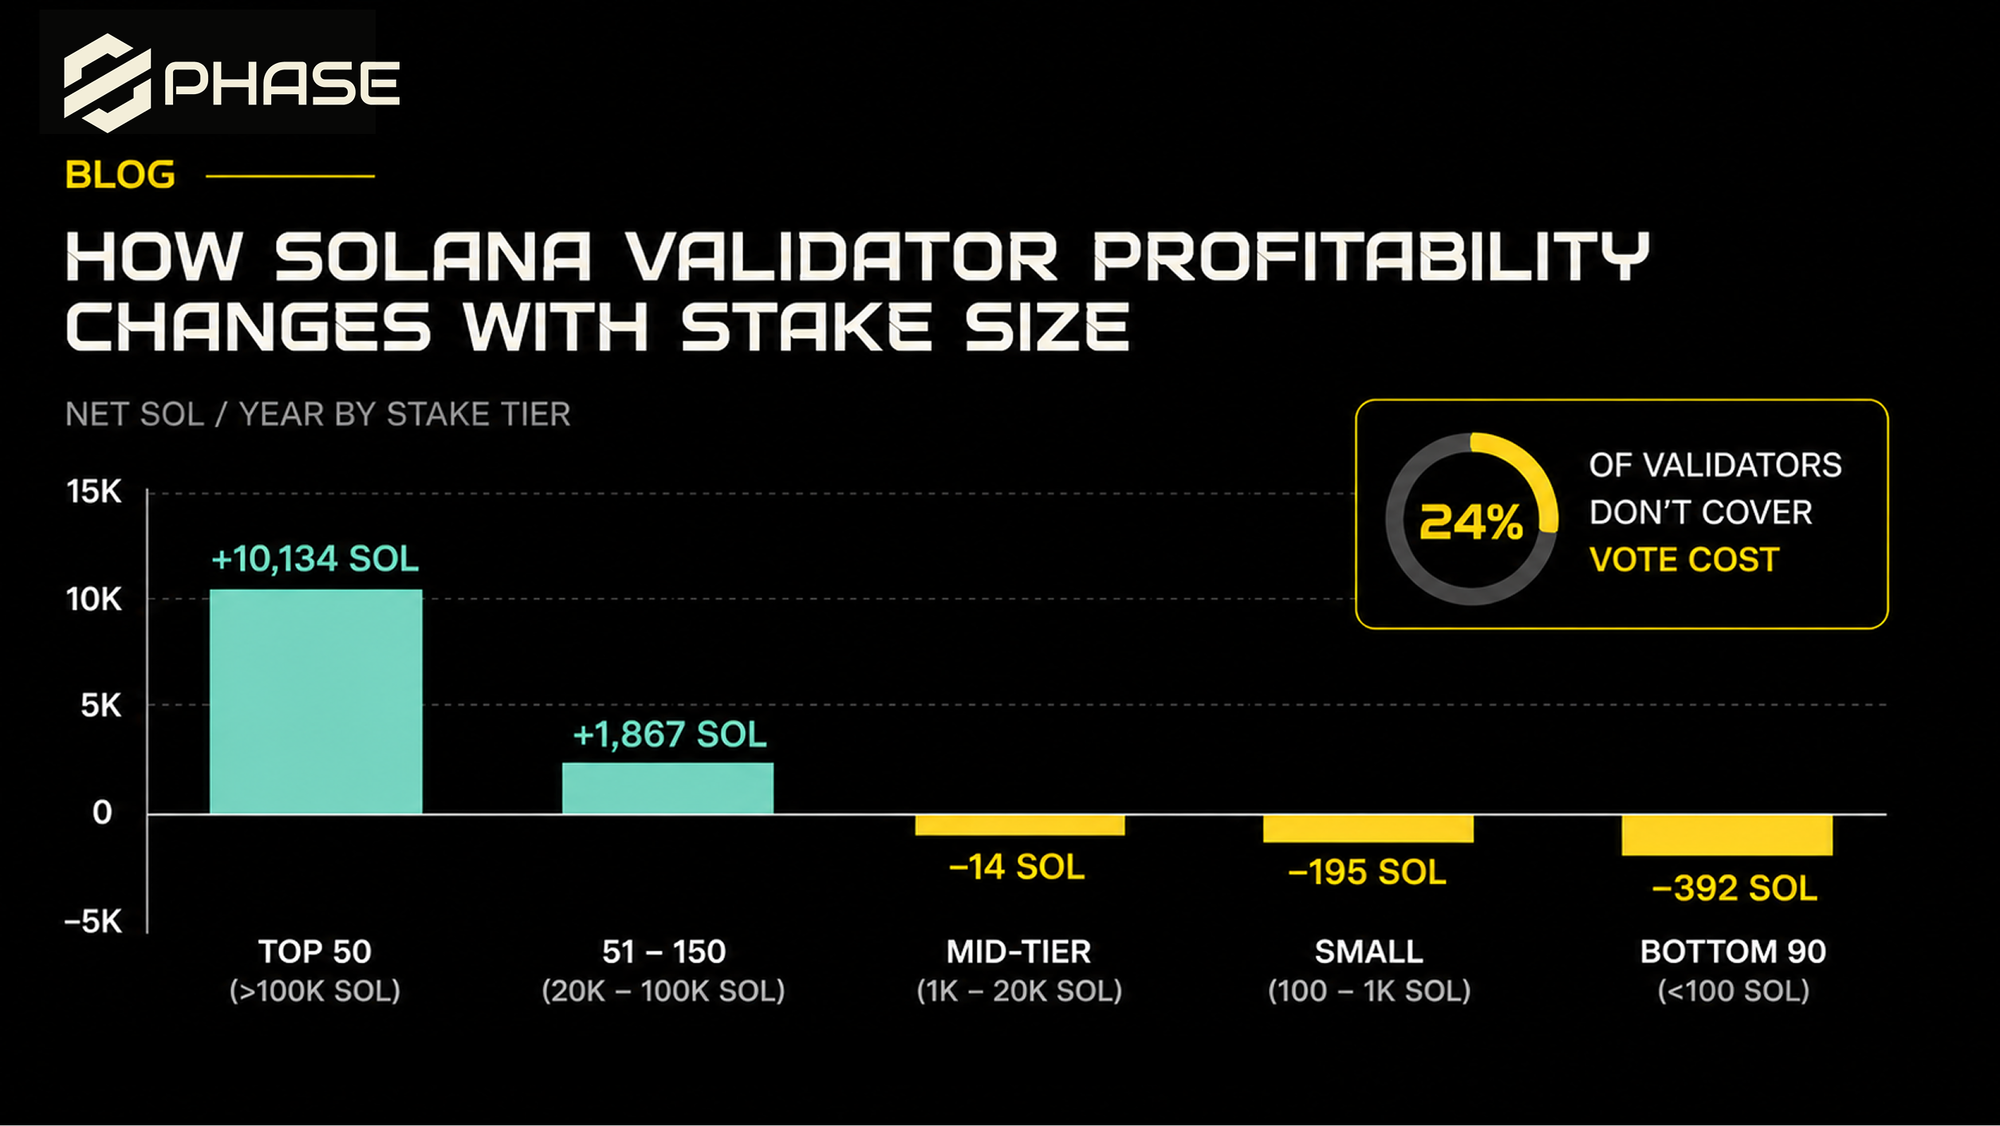
The combined effect of concentrated priority fees and fixed costs produces a profitability curve that is steeper than most operators expect.
A top-50 validator with roughly 2.67 million SOL in stake, running a 4 percent commission, nets around 10,134 SOL per year after vote cost and a $10,000 server budget. A large validator in the 51-150 rank range nets around 1,867 SOL per year. A mid-tier validator at 189,000 SOL, 0 percent commission, nets negative 14 SOL per year. A small validator around 73,000 SOL nets negative 195 SOL per year. A tiny validator in the bottom 90 nets roughly negative 392 SOL per year.
Those numbers translate to an uncomfortable statistic: 24 percent of active validators do not earn enough to cover their vote cost alone. 35 percent do not cover vote plus server. More than a third of operators are running at a loss before anyone on the team gets paid.
Break-even math depends on commission. At 2 percent, a validator needs around 141,000 SOL in delegation to cover roughly $43,000 in annualized operating expenses. At 5 percent, it is around 100,000. At 10 percent, it is around 67,000. This is the commission-stake inverse relationship visible across the validator set: small operators need higher commission just to survive. Mid-tier validators running 0 percent commission are usually subsidized by stronger priority fee capture or by operating for ecosystem reasons rather than strict profit.
SFDP subsidy during the first year shifts the math meaningfully. A new operator with full vote cost coverage in months 1-3 operates with effectively no fee expense, which brings break-even down to roughly 75,000 SOL at 5 percent commission. When month 13 arrives and coverage drops to zero, any operator who has not grown past that threshold faces a structural loss. This is the moment where the validator count typically contracts.
What Solana validator economics mean for delegation
A validator's economic math is the reason stakepool delegation matters so much at the margin. For a small-to-mid validator, an additional 100,000 SOL in delegation can be the difference between negative 68 SOL per year and a profitable operation. For a large validator, the same 100,000 SOL moves the P&L by a fraction of a percent. This is also the reason merit-based delegation frameworks like the IPS exist: concentrating stake on operators who are actually doing the work changes the economics for the ones who matter.
The Phase Validator Calculator exists to make that math concrete. Plug in your stake, commission, client, and server setup. Add delegation. See how the six line items actually move when the underlying variables change. It is the same framework this post walks through, with real numbers.
The math is public. The distribution is the story.
Every line item discussed here is documented, reproducible, and open to anyone who wants to run the math. Vote costs are on-chain. Server costs are on vendor websites. Priority fee data is accessible through public APIs. Solana validator economics is one of the most transparent operating environments in crypto.
What the data makes clear is that the story is not in the line items. It is in the distribution. The averages look healthy. The medians tell a different story. And the gap between the top decile and everyone else is what determines who stays in business.
Run your own numbers at phase.cc/delegation/calculator.
Apply to Phase Delegation at phase.cc/delegation.